
3.3 How To Create Dummy Variables And Normalization
Load Package And Data
load("../../data/craet_3-2.Rdata")
library(tidyverse)
library(caret)
Why Dummy Variables
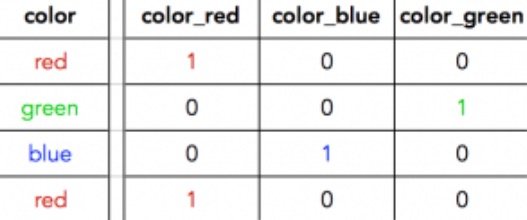
对于字符型的因子变量,我们需要把它转变为有序的数值,一般转为 0,1 的二变量, 这样0 就代表基础水平, 1代表比较组
How
# One-Hot Encoding
# Creating dummy variables is converting a categorical variable to as many binary variables as here are categories.
dummies_model <- dummyVars(Purchase ~ ., data=trainData)

# Create the dummy variables using predict. The Y variable (Purchase) will not be present in trainData_mat.
trainData_mat <- predict(dummies_model, newdata = trainData)

# # Convert to dataframe
trainData <- data.frame(trainData_mat)

# # See the structure of the new dataset
str(trainData)
## 'data.frame': 857 obs. of 18 variables:
## $ WeekofPurchase: num -1.1 -1.74 -1.68 -1.29 -1.04 ...
## $ StoreID : num -1.29 -1.29 1.33 1.33 1.33 ...
## $ PriceCH : num -1.14 -1.73 -1.73 -1.14 -1.14 ...
## $ PriceMM : num -0.688 -2.898 -2.898 -0.688 -0.688 ...
## $ DiscCH : num -0.452 -0.452 -0.452 -0.452 -0.452 ...
## $ DiscMM : num -0.582 -0.582 -0.582 1.341 1.341 ...
## $ SpecialCH : num -0.429 -0.429 -0.429 2.329 -0.429 ...
## $ SpecialMM : num -0.42 -0.42 -0.42 -0.42 -0.42 ...
## $ LoyalCH : num -0.205 -0.525 1.256 1.324 1.35 ...
## $ SalePriceMM : num 0.113 -1.101 -1.101 -1.506 -1.506 ...
## $ SalePriceCH : num -0.431 -0.844 -0.844 -0.431 -0.431 ...
## $ PriceDiff : num 0.341 -0.563 -0.563 -1.165 -1.165 ...
## $ Store7.No : num 1 1 0 0 0 0 0 0 0 1 ...
## $ Store7.Yes : num 0 0 1 1 1 1 1 1 1 0 ...
## $ PctDiscMM : num -0.588 -0.588 -0.588 1.447 1.447 ...
## $ PctDiscCH : num -0.448 -0.448 -0.448 -0.448 -0.448 ...
## $ ListPriceDiff : num 0.211 -1.988 -1.988 0.211 0.211 ...
## $ STORE : num -0.457 -0.457 -1.15 -1.15 -1.15 ...Why Normalization
为了消除不同变量由于单位造成的权重影响,我们对数据进行数据标准化
How
- range: Normalize values so it ranges between 0 and 1
- center: Subtract Mean
- scale: Divide by standard deviation
- BoxCox: Remove skewness leading to normality. Values must be > 0
- YeoJohnson: Like BoxCox, but works for negative values.
- expoTrans: Exponential transformation, works for negative values.
- pca: Replace with principal components
- ica: Replace with independent components
- spatialSign: Project the data to a unit circle
preProcess_range_model <- preProcess(trainData, method='range')
trainData <- predict(preProcess_range_model, newdata = trainData)

# Append the Y variable
trainData$Purchase <- y

apply(trainData[, 1:10], 2, FUN=function(x){c('min'=min(x), 'max'=max(x))})
## WeekofPurchase StoreID PriceCH PriceMM DiscCH DiscMM SpecialCH
## min 0 0 0 0 0 0 0
## max 1 1 1 1 1 1 1
## SpecialMM LoyalCH SalePriceMM
## min 0 0 0
## max 1 1 1save.image(file = "../../data/craet_3-3.Rdata")