简单拟合一个线性模型 states <- as.data.frame(state.x77[,c("Murder", "Population", "Illiteracy", "Income", "Frost")]) fit <- lm(Murder ~ Population + Illiteracy + Income + Frost, data=states) #summary(fit) 线性模型假设的综合验证 使用gvlma包中的gvlma函数验证模型的线性假设。gvlma函数由Pena和Slate ( 2006 )编写,能对线性模型假设进行综合验证,同时还能做偏斜度、峰度和异方差性的评价。换句话说,它给模型假设提供了一个单独的综合检验(通过/不通过)。 # Listing 8.8 - Global test of linear model assumptions library(gvlma) gvmodel <- gvlma(fit) summary(gvmodel) ## ## Call: ## lm(formula = Murder ~ Population + Illiteracy + Income + Frost, ## data = states) ## ## Residuals: ## Min 1Q Median 3Q Max ## -4.

Continue reading

Load Package And Data load("../../data/craet_8.Rdata") library(tidyverse) library(caret) #Set Parallel Processing - Decrease computation time if (!require("doMC")) install.packages("doMC") library(doMC) registerDoMC(cores = 4) Train Multiple Models So now we have predictions from multiple individual models.To do this we had to run the train() function once for each model, store the models and pass it to the res library(caretEnsemble) # Stacking Algorithms - Run multiple algos in one call. trainControl <- trainControl(method="repeatedcv", number=10, repeats=3, savePredictions=TRUE, classProbs=TRUE) algorithmList <- c('rf', 'adaboost', 'earth', 'svmRadial') set.

Continue reading

Load Package And Data load("../../data/craet_7.Rdata") library(tidyverse) library(caret) #Set Parallel Processing - Decrease computation time if (!require("doMC")) install.packages("doMC") library(doMC) registerDoMC(cores = 4) Caret provides the resamples() function where you can provide multiple machine learning models and collectively evaluate them Define the training control fitControl <- trainControl( method = 'cv', # k-fold cross validation number = 5, # number of folds savePredictions = 'final', # saves predictions for optimal tuning parameter classProbs = T, # should class probabilities be returned summaryFunction=twoClassSummary # results summary function ) train models set.

Continue reading

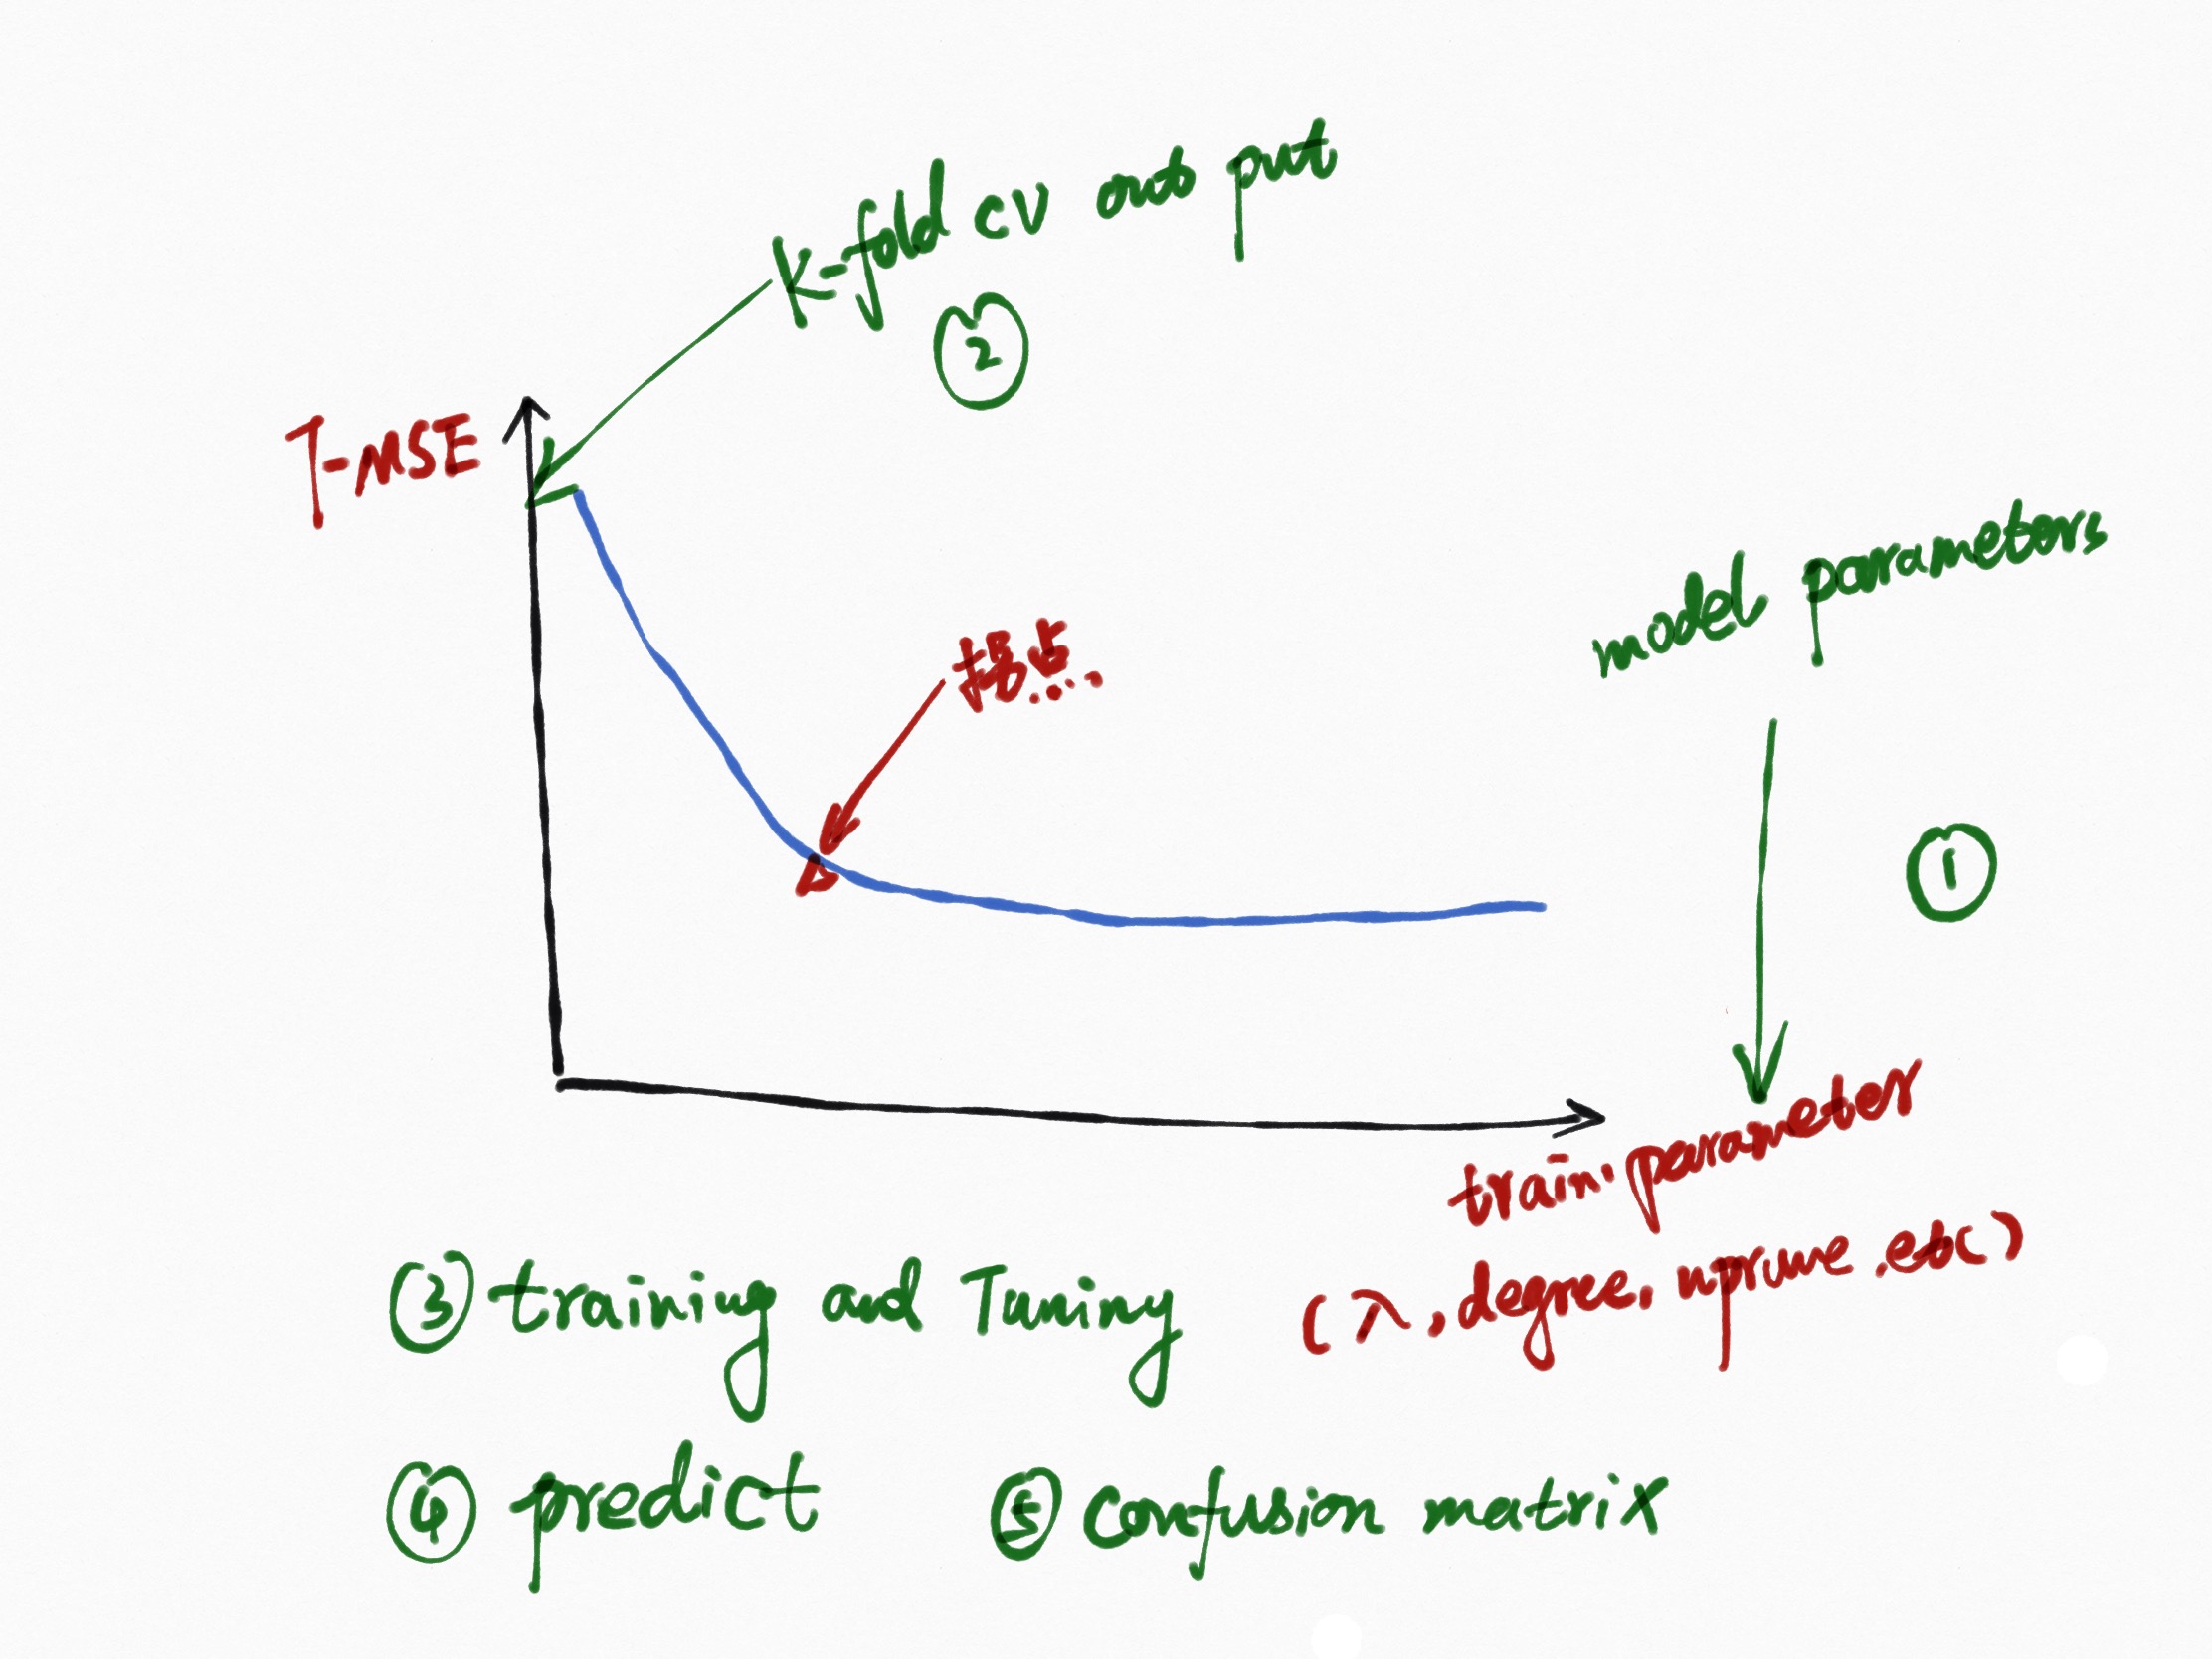
Load Package And Data load("../../data/craet_6.Rdata") library(tidyverse) library(caret) # Set Parallel Processing - Decrease computation time if (!require("doMC")) install.packages("doMC") library(doMC) registerDoMC(cores = 4) Hyper parameter tuning using tuneGrid Model Tuning Parameter Set Cross Validation Set Cross validation method can be one amongst: ‘boot’: Bootstrap sampling ‘boot632’: Bootstrap sampling with 63.2% bias correction applied ‘optimism_boot’: The optimism bootstrap estimator ‘boot_all’: All boot methods. ‘cv’: k-Fold cross validation ‘repeatedcv’: Repeated k-Fold cross validation ‘oob’: Out of Bag cross validation ‘LOOCV’: Leave one out cross validation ‘LGOCV’: Leave group out cross validation Training And Tuning

Continue reading

Load Package And Data Training 1. How to train the model and interpret the results? Once you have chosen an algorithm, building the model is fairly easy using the train() function train() does multiple other things like: Cross validating the model Tune the hyper parameters for optimal model performance Choose the optimal model based on a given evaluation metric Preprocess the predictors (what we did so far using preProcess()) 2.

Continue reading

You might need a rigorous way to determine the important variables first before feeding them to the ML algorithm. This is important. A good choice of selecting the important features is the recursive feature elimination (RFE) RFE works in 3 broad steps: Step 1: Build a ML model on a training dataset and estimate the feature importances on the test dataset.(在确定自由度的情况下,评价变量在测试数据集中的重要性) Step 2: Keeping priority to the most important variables, iterate through by building models of given sizes.

Continue reading

Load Package And Data load("../../data/craet_3-3.Rdata") library(tidyverse) library(caret) Q: How The Predictors Influence The Y 选择重要的变量: 通过观察在Y的分组下各个变量的分布情况 一般有 箱线图 和 密度图 box-plot featurePlot(x = trainData[, 1:18], y = trainData$Purchase, plot = "box",#"density" strip=strip.custom(par.strip.text=list(cex=.7)), scales = list(x = list(relation="free"), y = list(relation="free"))) Density featurePlot(x = trainData[, 1:18], y = trainData$Purchase, plot = "density", strip=strip.custom(par.strip.text=list(cex=.7)), scales = list(x = list(relation="free"), y = list(relation="free"))) save.image("../../data/craet_4.Rdata")

Continue reading

Author's picture

Jixing Liu

Reading And Writing

Data Scientist

China